Catch your first frontend error in five minutes
A button that does nothing. A page that goes blank. These bugs only show up in a real user’s browser, on some combination of device, OS, and network you never tested. They never reach your server logs, and often nobody reports them. People just get frustrated and leave.
Closing that gap takes about five minutes and one package, with nothing to host. This guide goes end to end: sign up, add the tracker, trigger a real error on purpose, and watch it land in your dashboard with a full stack trace. It covers two setups, a plain script tag for any site and the npm package for React, so follow whichever matches your stack. If you would rather set everything up from the terminal, the CLI walkthrough is the sibling to this one.
The setup
Step 1: Sign up and grab your key
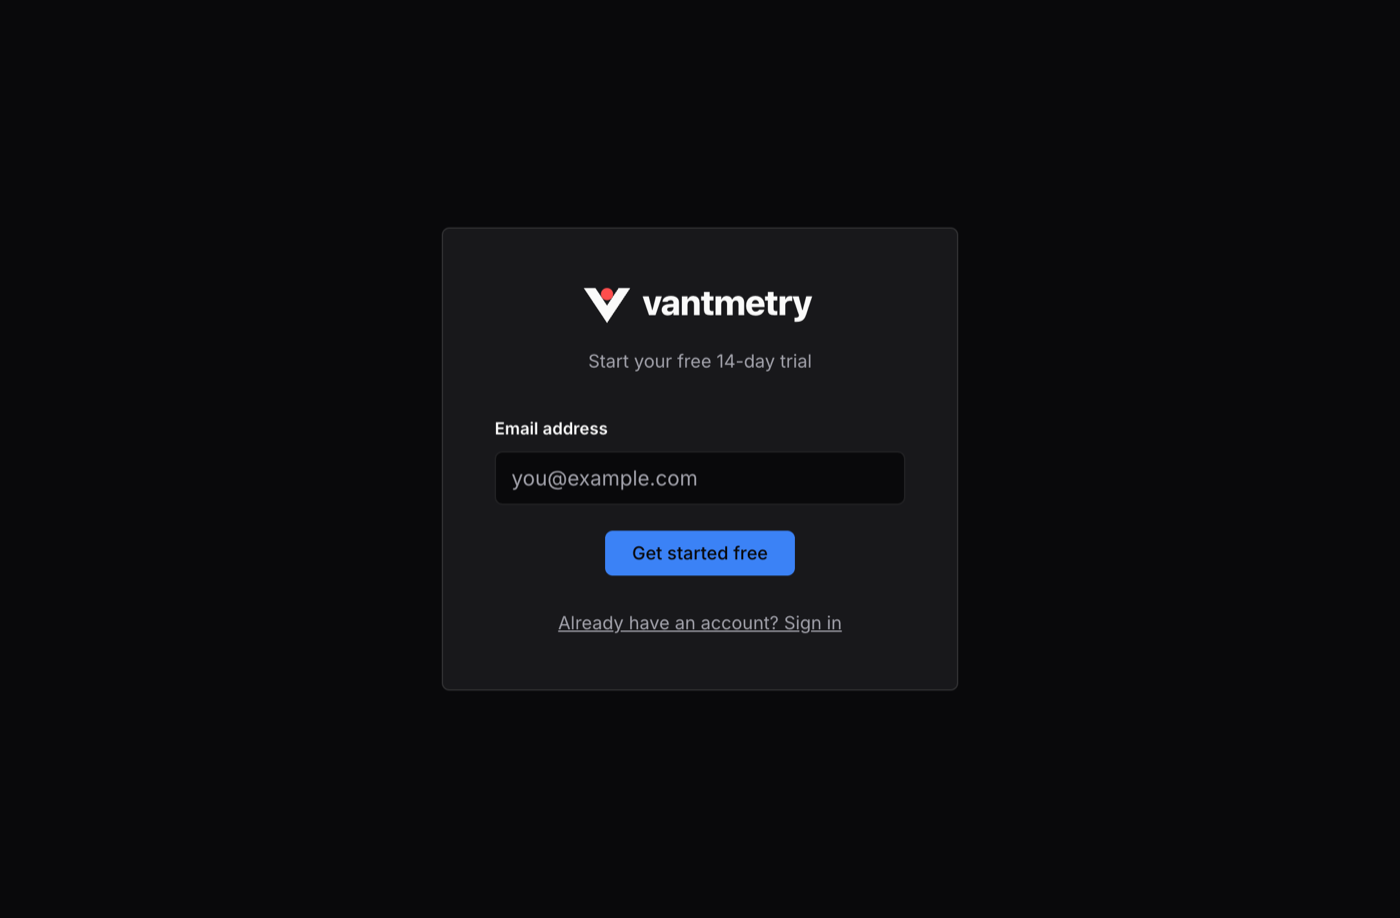
Signing up for the free 14-day trial is one field. You enter your email, and Vantmetry sends a secure, single-use link that expires after fifteen minutes or the moment you use it, whichever comes first. There is no password to choose, store, or leak.
Once you are in, open project settings and create a public key. It starts with vpk_, and creating one gives you a snippet ready to copy straight into your website.
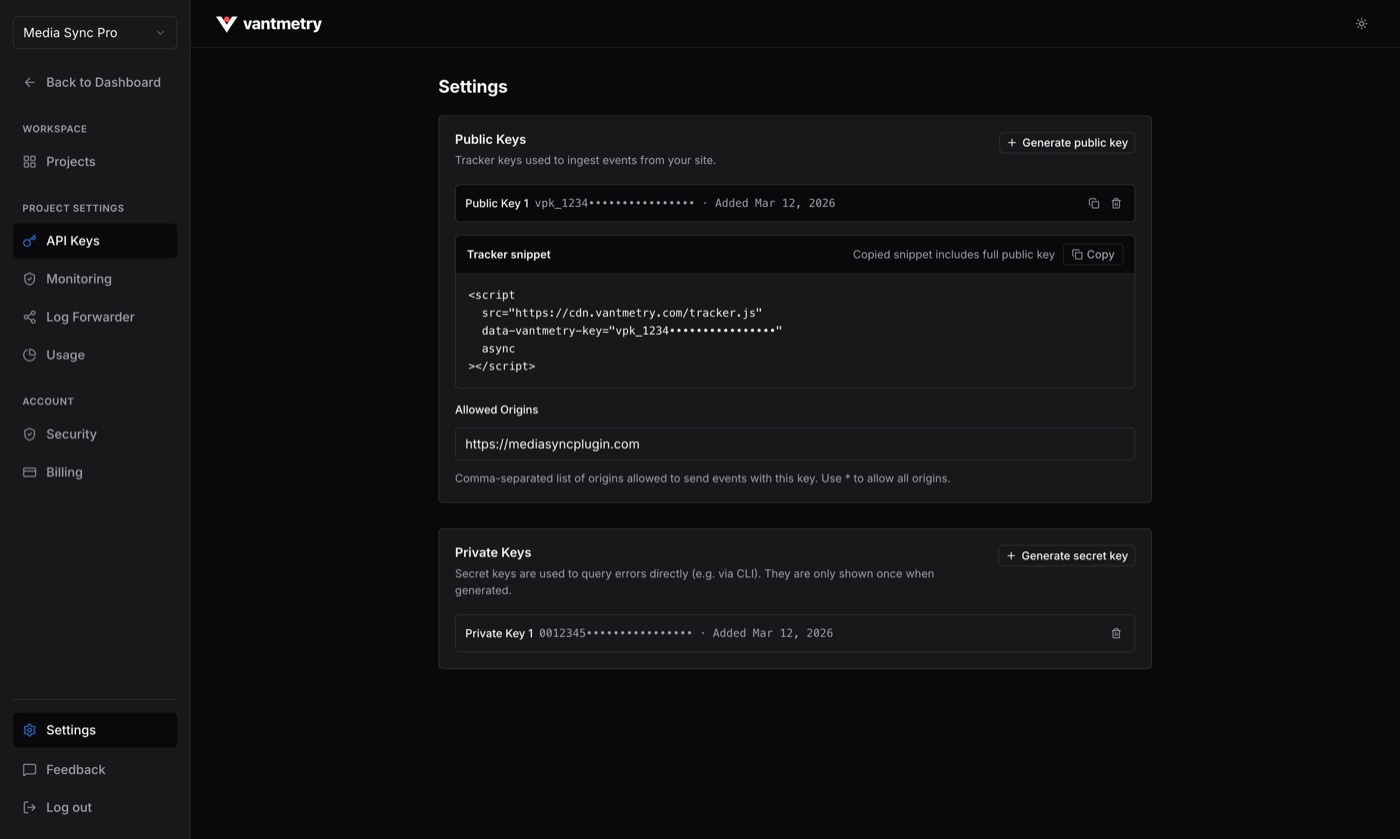
The public key is built to live in browser code. It can only send logs, never read or change anything, so shipping it to the client is safe by design. Keep the vsk_ secret key for server-side use. It never goes near the browser.
Step 2: Add the tracker
The tracker is a small script you can read in full on npm, so you can see exactly what runs in your users’ browsers. It also scrubs sensitive data, things like auth tokens, emails, and anything that looks like a password or secret, before any of it leaves the browser.
From the moment it loads it listens for the browser’s error event, captures uncaught errors, unhandled promise rejections, and anything sent to console.error across the whole app, with no handlers for you to write.
There are two ways to add it. Use Option A for a plain site with no build step, or Option B for a React app.
Option A: Plain HTML, no build step
Add one tag to your <head>. It starts capturing the moment it loads, no other code required:
<script src="https://cdn.vantmetry.com/tracker.js" data-vantmetry-key="vpk_your_key_here"></script>For errors you already catch, log them with context so the dashboard shows what the user was doing, not just that something broke. The script exposes a global you can call anywhere:
try {
  await saveProfile(profile);
} catch (error) {
  window.Vantmetry.error('Save failed', {
    profileId: profile.id,
    endpoint: '/api/profile',
  });
  throw error;
}
Option B: React
Install the package and wrap your root once with VantmetryProvider. This initializes the tracker a single time and makes the logger available through context:
npm install vantmetry// src/main.tsx
import { StrictMode } from 'react';
import { createRoot } from 'react-dom/client';
import { VantmetryProvider } from 'vantmetry/react';
import App from './App';
createRoot(document.getElementById('root') as HTMLElement).render(
<StrictMode>
<VantmetryProvider publicKey="vpk_your_key_here">
<App />
</VantmetryProvider>
</StrictMode>,
);For errors you already catch, the useLogger hook gives you the logger from any component under the provider:
// src/components/SaveButton.tsx
import { useLogger } from 'vantmetry/react';
import { saveProfile } from '../lib/profile';
import type { Profile } from '../types';

export function SaveButton({ profile }: { profile: Profile }) {
  const logger = useLogger();

  async function handleSave() {
    try {
      await saveProfile(profile);
    } catch (error) {
      logger.error('Save failed', {
        profileId: profile.id,
        endpoint: '/api/profile',
        action: 'save',
      });
      throw error;
    }
  }

  return <button onClick={handleSave}>Save changes</button>;
}
The context object rides along with the error, so the dashboard shows “Save failed” with the profile id and endpoint attached, not just a bare stack trace.
React also has render crashes, which behave differently. An error thrown during render does not reach the global handler the way a click handler does. React unmounts the tree and, without a boundary, the user gets a blank page. VantmetryErrorBoundary catches the crash, logs it with the component stack, and shows your fallback instead. React’s own docs explain the underlying error boundary mechanism. The Vantmetry one wires the logging in for you:
// src/App.tsx
import { VantmetryErrorBoundary } from 'vantmetry/react';
import { Dashboard } from './pages/Dashboard';
import { ErrorFallback } from './components/ErrorFallback';

export default function App() {
  return (
    <VantmetryErrorBoundary fallback={<ErrorFallback />}>
      <Dashboard />
    </VantmetryErrorBoundary>
  );
}
Nest boundaries around individual sections so one broken widget never takes down the whole page. The React integration docs cover the hook, the provider, and the boundary in full.
Step 3: Trigger a test error
Whichever option you chose, prove capture works the same way. Force a classic crash, reading a property off data that turned out to be null, somewhere that runs on the page:
const user = JSON.parse('null');
console.log(user.name); // Cannot read properties of null
Load the page. The tracker catches the uncaught error and sends it on to the dashboard. Nothing about it touched your server, which is exactly the kind that normally vanishes.
Step 4: Watch it land in the dashboard
Open the Issues view. Your error is there, grouped by fingerprint, with how many times it has fired and how many sessions it hit:
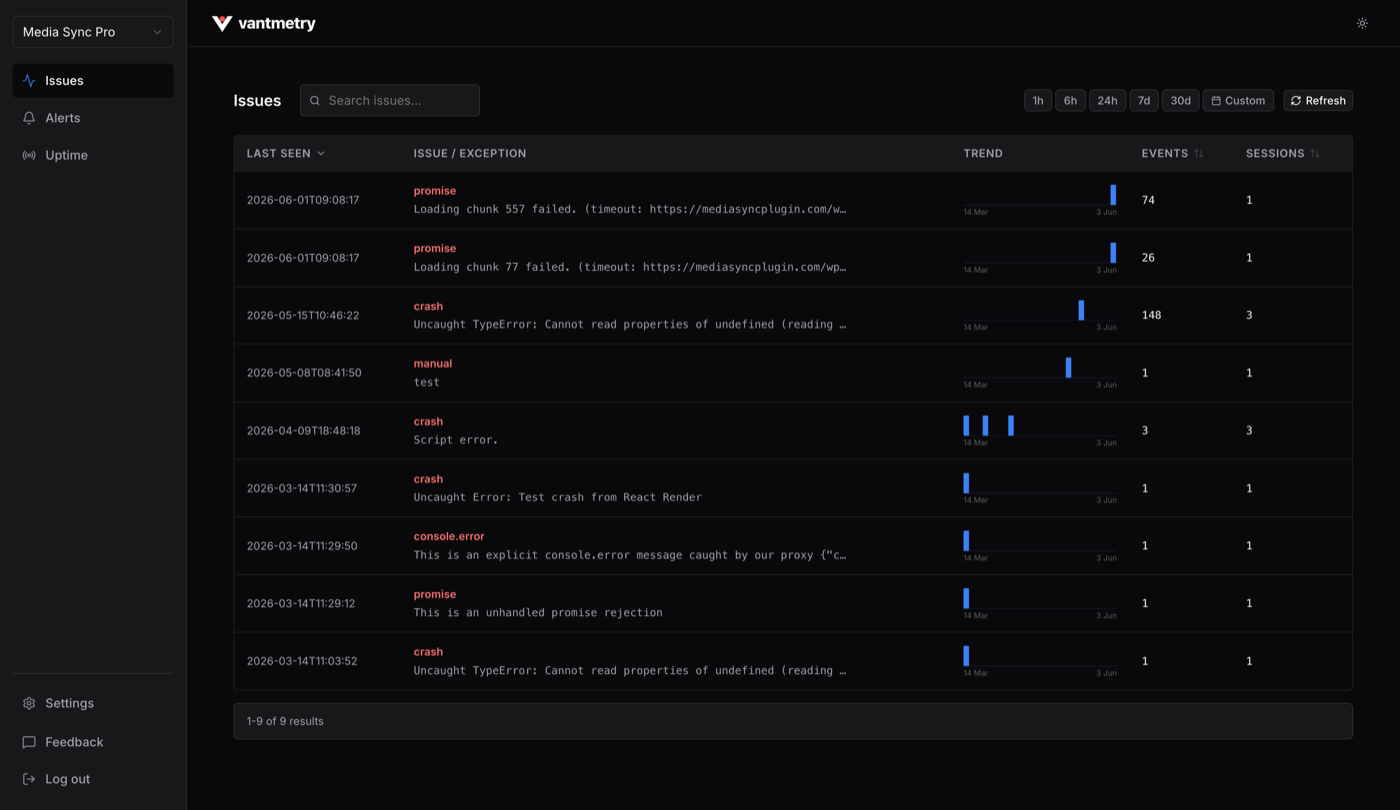
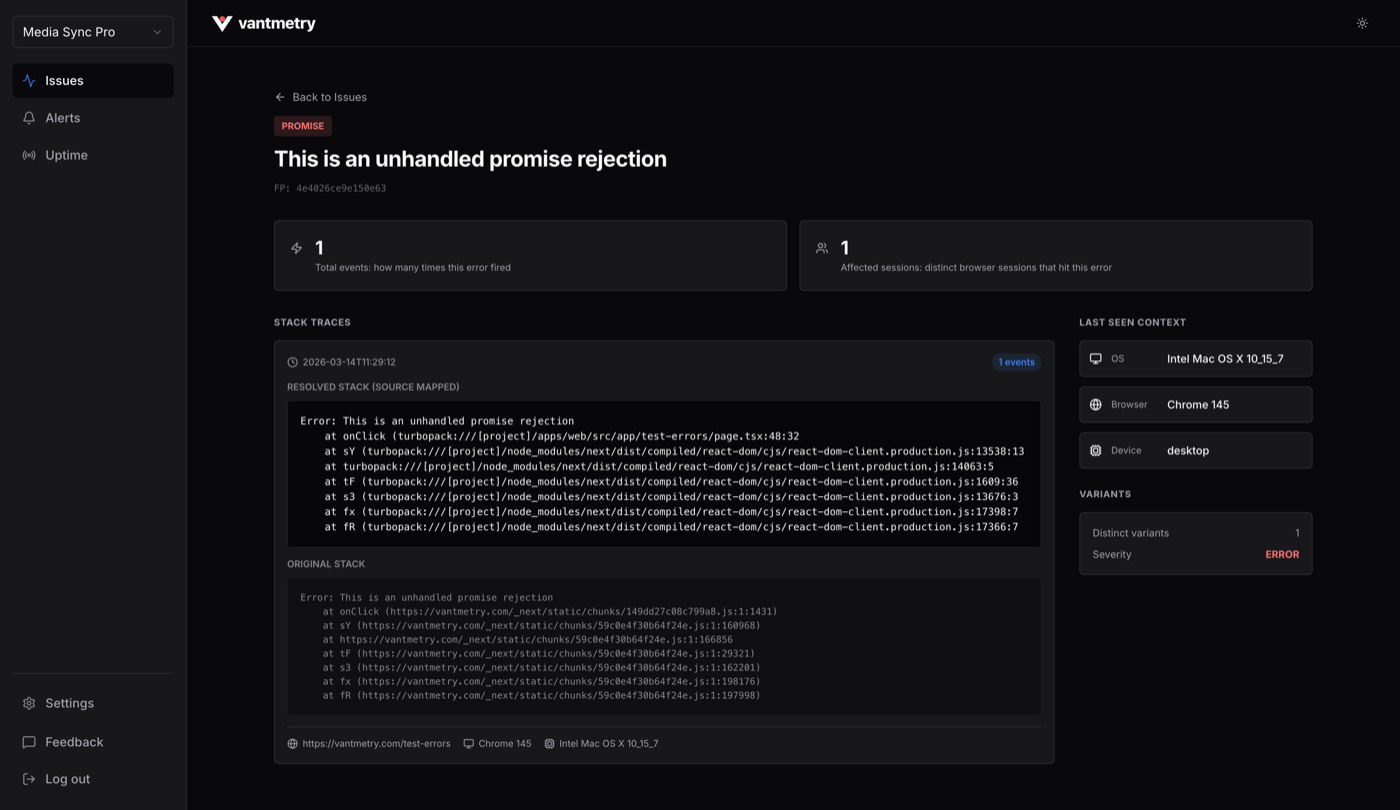
Click it for the full picture: the stack trace resolved back to your original source, the raw minified trace underneath, and the browser, OS, and device of the session that hit it.
What you did not have to do
That is the whole setup. What was absent from it is the point:
| You skipped | Why it never came up |
|---|---|
| Standing up a backend or database | The tracker is client code. Ingestion and storage are hosted |
| Tuning retention or capping data | Old errors rotate out on their own, which is what keeps the price fixed |
| Bracing for a spike | A bad deploy throwing the same error thousands of times is deduplicated and contained |
| Shipping a heavy dependency | The tracker is small and published on npm, so you can read every line first |
| Slowing the site down | Capture runs in the background and survives the page unloading |
Frequently asked questions
Do I need a backend to use this?
No. The tracker runs in the browser and Vantmetry hosts ingestion and storage. There is nothing for you to deploy, scale, or keep running.
Is it safe to put the key in client-side code?
Yes. The public key can only send logs. It cannot read, change, or delete your data, and rate limits and a circuit breaker stop anyone abusing it.
Do I need the error boundary, or is the provider enough?
The provider already captures uncaught errors, unhandled promise rejections, and console.error everywhere. The boundary adds React render-crash capture and a fallback UI, so use both.
Will the tracker slow down my site?
No. It is a small script that sends errors in the background without blocking rendering, and it keeps working as the page unloads.
Where to go next
Once the tracker is in, there is nothing new to maintain. A couple of natural next steps:
- Add a passkey so each login is one tap, with no email link to wait for. Register one in account settings.
- Point a webhook at your project so an error spike or downtime finds you instead of you watching a dashboard.